
Google Trends is an amazing tool which allows you to understand search interest in a specific topic over time. The ability to monitor these topics in specific regions is really useful for international content campaigns. It ultimately allows you to create engaging content by staying ahead of the curve and understand new trends as soon as they emerge.
Sadly, there is no official Google Trends API, so we will get the trend data from an alternative tool called G-Trends by X-Fran. We will have a look over the various parts of the tool and how they can be used to obtain data from Google Trends. Specifically, we will be looking at the Interest Over Time feature and how looking back over historical data can be very useful when identifying patterns and seasonal trends to accurately predict trends of the future.
With some inspiration from some French patisserie, we can discuss some of the trends options available and make requests to the G-Trends API. The raw data we get will be in JSON format so you can use a development language of your choice thereafter. Then, we will format the raw data and then discuss some storage options. Finally, we will do some basic transformations of the data collected that will be applicable to your web application or research document.
Introduction to a Google Trends Alternative
As mentioned earlier, Google Trends does not currently have an official API. So if you want to make a web application with its data, an unofficial tool will be required. For this task, we will use G-Trends by X-Fran, a great free tool that provides us with more than enough to get the data we need.
Let’s do a quick review of the tech we need for the project:
- G-Trends is written in PHP, so our initial request will use that.
- NPM, Node Package Manager, will be required to install some applications.
- G-Trends is installed using Composer, so this will also be needed.
- As a server-side language is used, we will need a virtual server app like WAMP or MAMP.
- Optional – You may want to store the data in a database, so a database app like Medoo could be useful.
G-Trends by X-Fran – Unofficial Google Trends API
Some of the features offered by G-Trends mirror the functions of the official Google Trends application. For example, G-Trends provides options to receive data for Related Queries and Suggestions Autocomplete – both of which are great for keyword inspiration in your relevant industry or topic.
We will be making use of the Interest Over Time feature of Google Trends because we will be looking retrospectively at the trend data for a specific keyword, in a specific country, over the course of six years. With the historical data, we can make a few assessments and spot seasonality and other trends, which give us an insight into future opportunities.
Making the Interest Over Time G-Trends Request
Create a new project in the development environment of your choice and open the command line. Enter the following command to install the packages used by G-Trends:
Note – There can sometimes be SSL issues with local virtual servers. Please refer to the WAMP or MAMP guides on creating locally issued SSL certificates for your computer. Additionally, there may be interference with anti-virus apps blocking the download. To get round this, please refer to guides on your specific anti-virus software and how to allow WAMP / MAMP to be exempt from the security checks.
Running the command above with create the files for all the packages required as well as some composer configuration files. Inside this folder, we can make a subfolder and it can be called as appropriate – I will call it “example”. It is best to keep your working files separate from the folder with PHP packages for organisation and security reasons. Inside this folder, make an index.php file and add the line to include vendor’s autoload file. Then we include the GTrends class from the namespace to include G-Trends in our project.
Once installed, the GitHub repository gives a nice example of setting up your options and deciding what data you want to collect. The example covers several of the controls seen on Google Trends, such as language, country, timeframe and time zone, as shown below.
Now, we will look at some of the specific options selected and a brief reason why they were chosen. The options were also tested in Google Trends for illustration purposes.
- Country Code (Geo) – The first option to set is the country code. This is available in Google’s documentation or you can use Google Trends and grab the codes from the URL. For example, France would be selected with FR.
- Language (HL) – Next is to select the language within the country. The language code is available in Google’s documentation. For example, standard French would be selected as fr.
- Timeframe (Time) – Next, is to set the date range to a suitable period of time. Currently, it needs to be at least 6 years long in order to get the data split by each month. The range can be set by adding two dates in YYYY-MM-DD format e.g. 2020-07-01 2026-07-31.
- Search Topic (Category) – I keep the category set to 0 so any trends data collected is as broad as possible.
- Time Zone (TZ) – I also keep the time zone to 0 so it can default to the suitable time zone of the selected country. Also, because the timeline is over several years, the time zone does not come into play.
Once the options are set up, we create a new G-Trends request by creating a variable and passing the options as a parameter to the G-Trends function. Looking at the documentation, the G-Trends function we are using is getInterestOverTime. We pass the keyword as a parameter to tie the keyword to a country at a specific date range.
Data Review and Language Considerations
Now we have made the request, we want to do some basic formatting so we can review the data. First, we can use HTML <pre> tags to ensure the text output maintains the same indents, line breaks and spaces so we can read it more easily. We can use the json_encode() function to convert the PHP array into JSON format. Finally, JSON_PRETTY_PRINT adds the line breaks and indentation that the <pre> tags are preserving. This way, we can see the data much more clearly and have a strong idea of what options are available.

Using JSON Data For The First Time
It is at this point, you could store the JSON data and then switch to using a development language of your choice, if PHP is not your first pick. The way the data is processed depends on which development library is being used. The new format is universally compatible with other languages, including front-end languages such as JavaScript. Rather than using standard PHP, it is possible to use a PHP library such as CodeIgniter. The data could be processed and stored in a database using a PHP package such as Medoo. For the sake of simplicity and clarity, our example will use standard PHP.
Processing the Raw Trends Data
Using PHP, the data coming back from G-Trends is already a PHP array so we can start working with it right away. An array is a common method of processing API requests and is suitable for carrying out some manipulations later on. Next is to set a variable for the months data by looking inside the array we just created and reference the array keys of TIMESERIES, then data and finally timelineData. This way, we can focus our attention specifically on the part of the array which has the month scores we need.
To finish off the preparation, we can create an empty Trend Scores variable to store the score values in an array. Using the echo feature of PHP, we can create a heading on the page above the list of months and trend scores. Now the data has been reviewed, we can also comment out the <pre> tags we made earlier, as they are no longer required.
Now we use the variable storing the trend array data and cycle through each individual month using a foreach loop. Inside the loop, the date of the month can be accessed by using “time” array key. To process the raw data for your application, it would be a good idea to turn the date into a suitable format by using the date function. In this case, “Y-m-d” provides the date in a YYYY-MM-DD format.
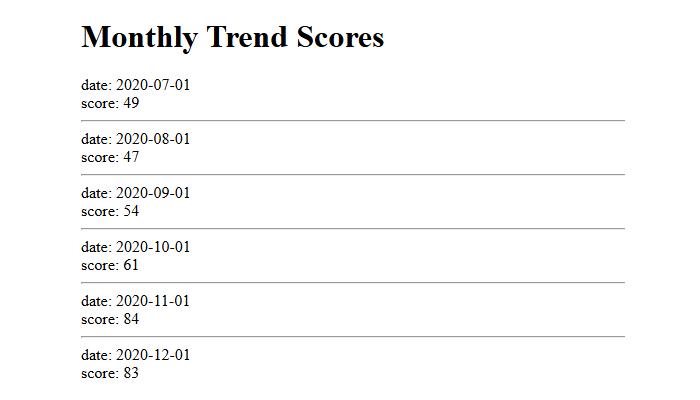
French Croissants Trend Score Raw Data
Similarly, the trend score for the month is accessible with the “value” array key. Adding both the month name and the suitable score to a pair of variables enables us to use the values again later in the application. For instance, we can use echo to display the values on the screen. Appending a line break after each value will make the content more manageable. Also, putting a <hr> before the end of the loop will add a horizontal row under each month and score combination.
Now the data is displayed on the page, the text can be copied into a spreadsheet for further analysis or stored in a database. If different combinations are required, then the options at the top of the script can be amended such as keyword, country, language etc. If you wanted to make a scalable, automated solution, the list of combinations could be stored in a database and the script could be amended to dynamically retrieve data depending on what combination was required.
Do Not Burn API Credits, If You Do Not Have To
Our example has been using the data directly from the G-Trends API and this works when retrieving fresh data for your chosen set of options. However, if you are working with the one set of sample data and editing a script to perform tests, it is not necessary to retrieve data from the API directly each time. You can create a variable with the sample raw data provided by G-Trends and perform tests on this data instead of making calls to the API each time. This way, we can cut down on the number of API credits being used. Being efficient with credits means you are less likely to be blocked by the application or can reduce costs if an API is not free.
To amend our script to be more efficient, we want to create a DEBUG_MODE constant below the “use XFran” line. If the debug is true, we are testing with the sample G-Trends data and not using any credits. If debug is false, testing is finished and we are getting data straight from the API. From there we can amend the script depending on whether debug is on or off. When debug mode is off, we can place the G-Trends request code inside the if statement e.g. vendor autoload, options such as language, country etc. We can also add the getInterestOverTime functions inside the if statement as it will only run when debug mode is off, as we only make API request if we are not testing. For when debug mode is on, we can copy the output of the JSON data in the <pre> tags and set this to the sample-data.json file. We can then set a second line where we convert the gTrendsResponse data to a PHP array using json_decode with the second parameter of true.
Now, we can switch debug mode on or off depending on whether live data is needed or not and API credits can be saved when doing some testing. The updated full script can be seen below with the additional debug checks added:
Bonus: Sample Data Transformations
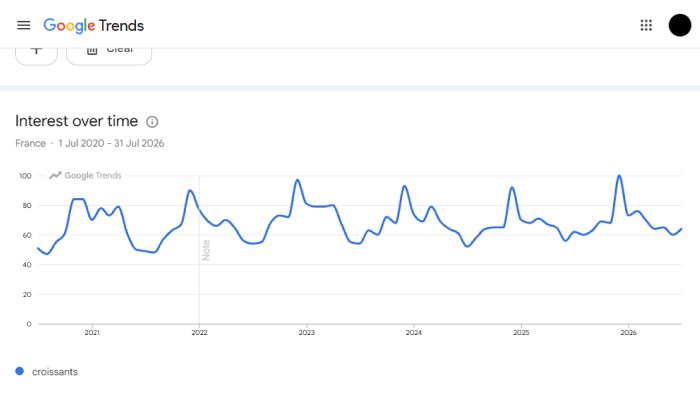
French Croissants Graph on Google Trends
Now you have collected and processed the raw data; it is ready to be transformed and analysed as you see fit. The options selected from our previous Google Trends example were used again for our data analysis. A quick note on the code is that anything starting with two slashes such as “//” is just a comment describing what the code is doing and the comments do not affect the code directly. There are a huge number of transformations that could be done; here are a few potential ideas to get you started.
Six-Year Average (Median)
First, we can look at the average in terms of the median value out of our monthly trend scores. This cuts out any short-term noise and gives a stronger understanding of the overall data set for the entire duration.
The result in my data set is a median of 67 out of 100. A median score of 67 gives a baseline for comparing search interest where demand is notably higher or lower than the typical level we identified.
Six-Year Average (Mean)
Second, you could get the average mean over the six-year period by dividing the total of the scores by the number of months in question. This is similar but distinct from the average median because the mean takes into consideration any abnormal spikes or drops in popularity.
The result in my data set is a mean of 68 out of 100. A mean score of 68 and median scores of 67 indicate the average search is representative of the typical level of interest across the timeframe. Had the scores been significantly different, there could have been some months with abnormally high scores.
Highest, Lowest and Range Scores
Another way of digesting the data is to get the lowest score, highest score and range in between. This method could allow you to see the range of trend scores and give a clearer understanding of the peaks and troughs of the data set.
In my dataset, the max is 100 and the lowest is 48, giving a score range of 52. This shows that search interest has varied over the period, with some months experiencing higher interest than others. Had there been a larger difference, it would indicate large seasonality with some months having low popularity.
Months Above a Specific Score
Following on from the average mean example, we can use this figure to collect the months that are above the average. Alternatively, the threshold could be manually set to a higher score if you wanted to measure the best-performing months. This provides an opportunity to collect months performing at a higher level and insights can be gleaned based on the patterns of the months collected. To do this, we need to amend the trend scores array in the first foreach loop in the script so the month and the score are displayed e.g. “January 2026” → 88 and so on.
There were 36 months above the average mean and the months appear to be seasonal with the trend starting to increase around October / November and then dropping off around March / April the following year. Some reasons for this are because weather is colder is winter / autumn and demand for comfort food is higher. Conversely, some bakeries close down for holidays during the summer, so demand naturally drops from there.
Top 5 Months
Following on from the above average months example, an alternative action that could be taken is to get the top 5 scores and the suitable name of the month. This way, we can spot some seasonality if there are any patterns in the top months, more specifically than all months above a certain threshold. As mentioned in the previous example, we need to amend the trend scores array in the first foreach loop in the script so the month and the score are displayed e.g. “January 2026” → 88 and so on.
The top five months were December of 2025, 2022, 2023, 2024 and 2021. So, building on from our previous example, we can focus on the trend and say popularity increases in December each year. As France is a country of Christian heritage, it can also be understood that the trend is related to Christmas and the wider holiday season. This can be extended to patisserie celebrations such as Bûche de Noël where croissants can be paired with other desserts.
So, looking at the examples, we have worked out that most searches are in and around the average popularity for the year, meaning croissants have a solid baseline of popularity throughout the year. On top of this, we spotted croissants start to increase around autumn and winter, meaning if you want to sell croissants in France, the colder months are where you can make more money. Finally, we uncovered popularity spikes in December each year, meaning Christmas is the time to make mega bucks in the croissant industry – tasty!
Conclusion
Whilst we do not have an official Google Trends API, G-Trends by X-Fran is a great tool that gives us more than enough trend data for your web application or research document.
The beauty of the tool is being able to turn the data into JSON format. From there, you can use the development language of your choice. For easier analysis, I would recommend storing the data in a database or spreadsheet. From there, you can connect it to a visualisation tool such as Google Data Studio and start enhancing your trend data.
If you are running an ongoing commercial operation, it may be a plan to get the data from a commercial partner. G-Trends is great for a one-off data collection or for establishing a conceptual MVP. However, the creator acknowledges it is an unofficial tool and it can be smart to get a reliable data partner such as Data For SEO or SERP API, so you can access reliable data on a longer timescale.
Ultimately, the ability to conduct ongoing monitoring of various trends lets you stay ahead of the curve and make smart, informed business decisions. Enjoy your croissants! 🥐