Identify and Translate Keywords and Markets
Google is widely accessible and reflects the behaviour of a broad consumer base, therefore search data often aligns closely with shifts in demand and sales performance around the world.
The trends tool utilises 20 different rum-related keywords across 15 different markets, resulting in a total of 300 combinations. The keywords were selected to encompass a range of different keyword types:
- Generic / Speciality Keywords (rum, dark rum, white rum) – to give an initial assessment of how popular rum is in each location.
- Cocktails (pina colada, mojito) – to see how they drive consumption in different types of markets.
- Brands (bacardi, malibu) – to see the global coverage of large brands as well as regional brands with a strong local presence.
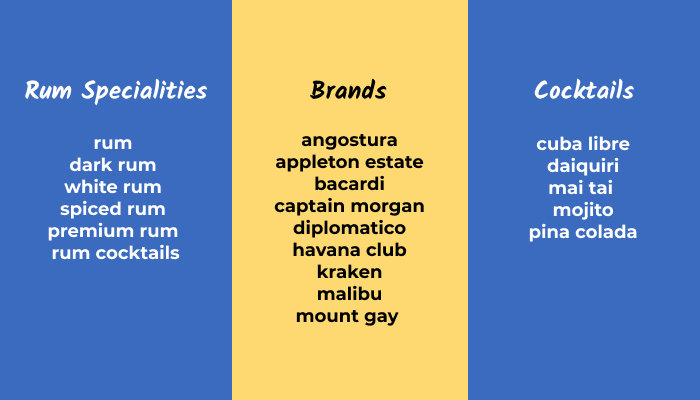
20 Rum-Related Keywords | Rum Compass
15 countries were chosen to showcase rum consumption in a diverse selection of international regions and to deliver insights that were as far-reaching as possible. The countries in specific regions were considered for the following reasons:
- Large Consumption Markets – Europe and North America
- Large Rum Producers – Caribbean
- Emerging Markets – Global South and the Far East
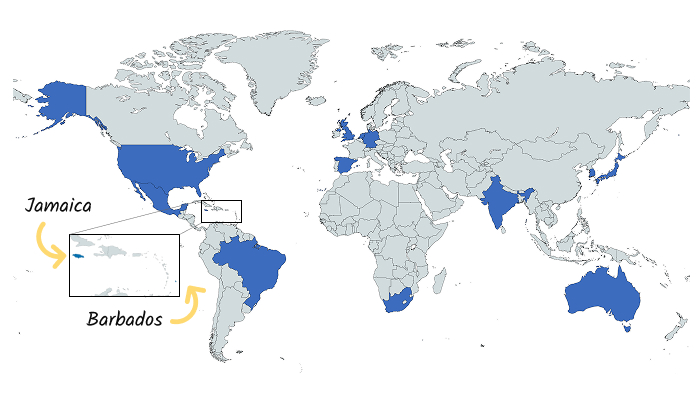
15 Countries Across Several Regions | Rum Compass
The keywords were then translated for each market in order to get search volume that was as accurate as possible by using the local equivalent of the keywords. The terms were translated using Google Translate, DeepL and TranslatePress, so it could be verified the translations were accurate.
Create Classifications with Rum Trends Data
Google Trends is a fantastic tool which allows you to understand search interest in a specific topic over time. The ability to monitor these topics in specific regions is really useful for international content campaigns. It ultimately allows you to create engaging content by staying ahead of the curve and understanding new trends as soon as they emerge.
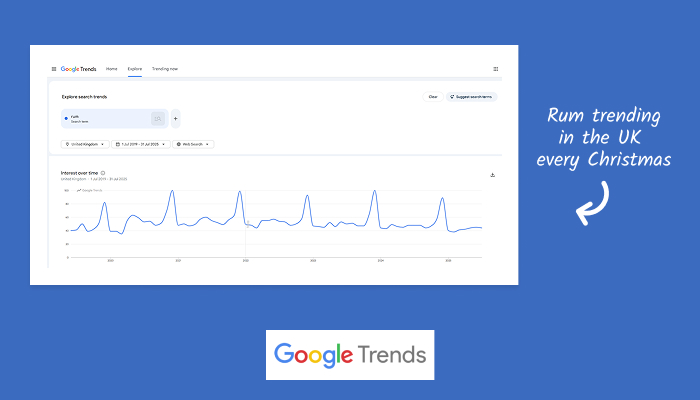
Rum Trends Data in the United Kingdom | Rum Compass
At this point, there is no official Google Trends API, so an alternative source was required. So, I used ‘G-Trends’ by X-Fran, a great free tool that provides us with more than enough to get the data we need. For each request, I put in the keyword, the selected market, the desired language and the date range.
The trends data provided gives a score from 0 to 100 for each month within the timeframe, which I then used to provide a trend classification. Note, the date range is six years as we need each trend score to be on a monthly basis – any less than six years would result in a weekly score.
To make the trend classification, the score for the current month needed to be compared to the scores of a few previous months within the date range:
- Previous Month
- Previous Quarter
- Previous Year (Same Month YOY)
- 6 Year Average
Doing the comparisons in this way enabled the focus to be on short-term trends and identify interest spikes. Conversely, including the 6-year average allows short-term noise to be balanced out by historical context. The annual checks enable any seasonality to be identified and taken into consideration.
To create the classification, the difference between each of the trend scores is compared. The larger the difference between the current month’s score and the comparison month, the larger the trend is likely to be. The differences between each of the comparisons (last month, last year etc.) are then averaged out to create a classification which ranges from “Massive Increase” and “Large Increase” down to “Mature” or “Declining”. Creating a set of incremental classifications allows you to see which combinations are trending currently, which combinations are likely to trend in the near future and which declining combinations should not be viewed as a priority.
Collect Search Volume Data from Google Ads
One of the limitations of the trends data is that it is limited to a relative score out of 100. The trouble this causes is that it makes it difficult to compare two different trend combinations without having some absolute numbers to compare the size of the trend.
As a solution, I decided to use the keyword planning tool in Google Ads to get the search volume. Google Ads requires a country and language to be selected before providing the list of keywords. Google Ads then provided the search volume as a monthly average over the past 12 months.
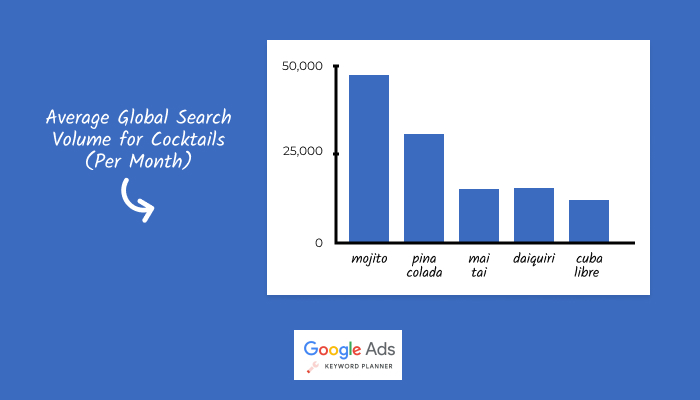
Search Volume Data For Globally Popular Cocktails | Rum Compass
With the search volume data collected for each combination, it was then considered alongside the trend classification to get a more well-rounded insight. For instance, all the trends showing as a ‘Massive Increase’ could be ranked by search volume as well, therefore highlighting the spikes in interest in the largest markets first.
Showcase Insights with Looker Studio Report
Once the data had been collected for each combination, it could be presented in a dashboard where all the insights could be gleaned easily. Google Looker Studio (formerly Data Studio) is a brilliant dashboard application that allows you to distil vast amounts of information into an organised and refined interface that is easy for non-technical users to understand.
The first screen of the report shows all the combinations and the paired classification. It was important to make this the first screen as understanding which keywords are trending in specific markets is the main purpose of the tool. Looker Studio enables the table to be filtered so you can focus your search on classifications of a specific keyword or market.
Google Looker Studio Insights Dashboard | Rum Compass
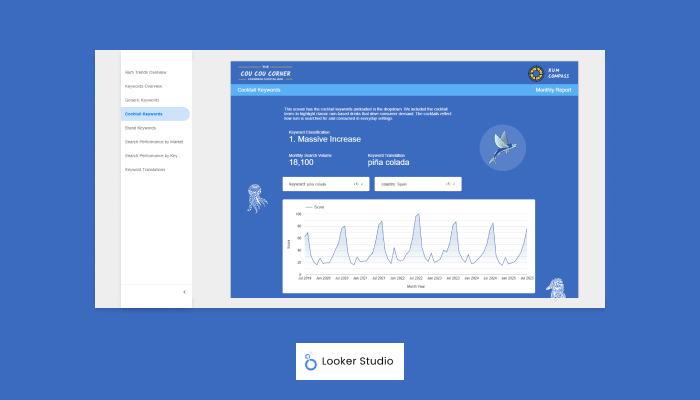
The next collection of screens focuses on a single combination and shows the trend in a graph and in a data table. This way, you can visualise the trend and quickly understand if and when a trend is taking place. The data table then allows granular access to the individual scores for each month within the six-year trend. This is part of a collection of screens where the filters are pre-populated depending on the focus i.e. all keywords, generic rum terms, cocktails and brands.
The next collection of screens shows the breakdown of search volume for each combination. The screens allow the detail to focus on either a keyword or a market. The country breakdown is provided along with the online population of each market and then the search volume is averaged out per 100,000 people. This way, the large country bias can be discounted and each market can be judged fairly and on its own merit.
There is a bonus screen showing the local translations for the keywords in all the markets. It shows the collective keyword such as “dark rum” and then shows all the translated versions, such as “dunkler rum” and “ron añejo”.
Insights Uncovered
With the report created, here are a few of the top-level insights that were discovered:
- Generic terms such as “rum”, “dark rum” are most popular at Christmas in Europe and North America.
- Cocktails drive rum-related interest during the summer months in Europe, America and the Global South.
- Local brands have varied interest depending on regional language i.e. Spanish brands “diplomatico” and “angostura” are more popular in Spain and Mexico.
- Emerging markets in the Far East show limited interest in specialist types of rum but show cocktails are driving drinking habits where rum is yet to fully take hold.
- Caribbean nations show limited seasonality – it is always sunny in the Caribbean!
- Some markets have brand domination that outperforms the standard generic term e.g. Australia uses “bundaberg” instead of “premium rum”.
Final Thoughts
Overall, Rum Compass was a great project for me to undertake as it enabled me to learn a substantive collection of different skills. It was great to get some development experience collecting the trend and search volume data, which is more complex than a standard API. Some of the translation work is useful for keyword research / SEO work I will do in the future and was helpful for adding context to some markets in the project. Furthermore, the Looker Studio report experience can be applied to the monthly report cycle I already undertake.
So, looking to the future, here are a few suggestions for tool improvement:
- The tool could have more keywords and markets. The set of keywords could be expanded and the number of countries could be increased to around 150.
- The search volume could be entwined with the trend data to give an absolute figure for the trend scores, which would enable multiple trends to be directly compared.
- A commercial project would require more reliable data sources, so paid tools could be used to retrieve the trend data and search volume.
- Data could be used from different search engines to target countries outside the Google ecosystem, such as Russia and China.
The project was ultimately an opportunity for me to get some conceptual experience of collating rum trends that could be used in a commercial setting. So, if you have a great project idea that is inspired by Rum Compass, then please get in touch and we can start working together today. Cheers! 🍹